2017 - 2019
Integrating the data apps ecosystem at LinkedIn.
This 2+ year project tackles the systemic issues with the disconnected collection of over 20+ products built in-house to create, process, and visualize data. After a year of research, product strategy, and validation, the department has been refining and executing our strategy.
Instead of disconnected silos of apps, the data apps are becoming an intelligently connected product suite. Instead of data only accessible to a select few, we are democratizing the data, by making interfaces more intuitive, so that more people in the company can use the information to make intelligent decisions and build a better company.
Vision & Goals:
Easier to Build: Better for Developers
Standardizing the Search UI also meant that all new objects and tools can inherit the same search behaviors, patterns and overall layout. Templates for search speeds the dev process because team of engineers can use common templates instead of reinventing basic user flows.
Easier to Use: Better for Users
It also helps users because they don't have to re-learn every app they use. Now all the functionality and features appear in the same place across all discovery experiences.
User Research:
Understand the users, apps, and problems
5 major user groups
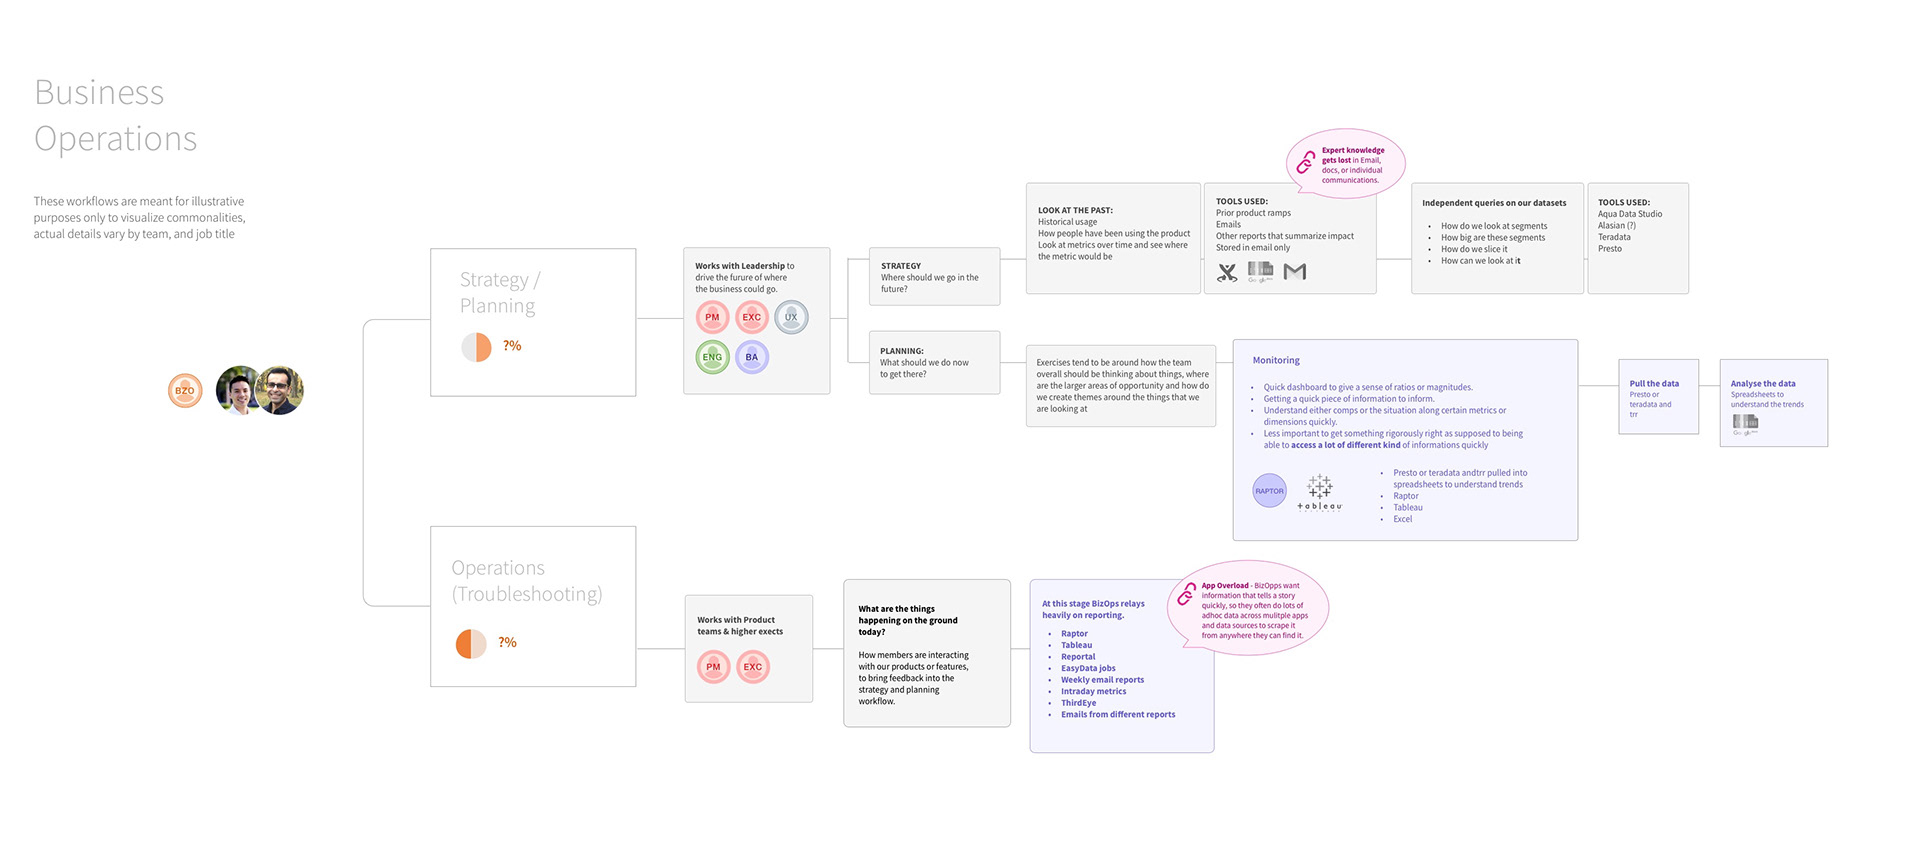
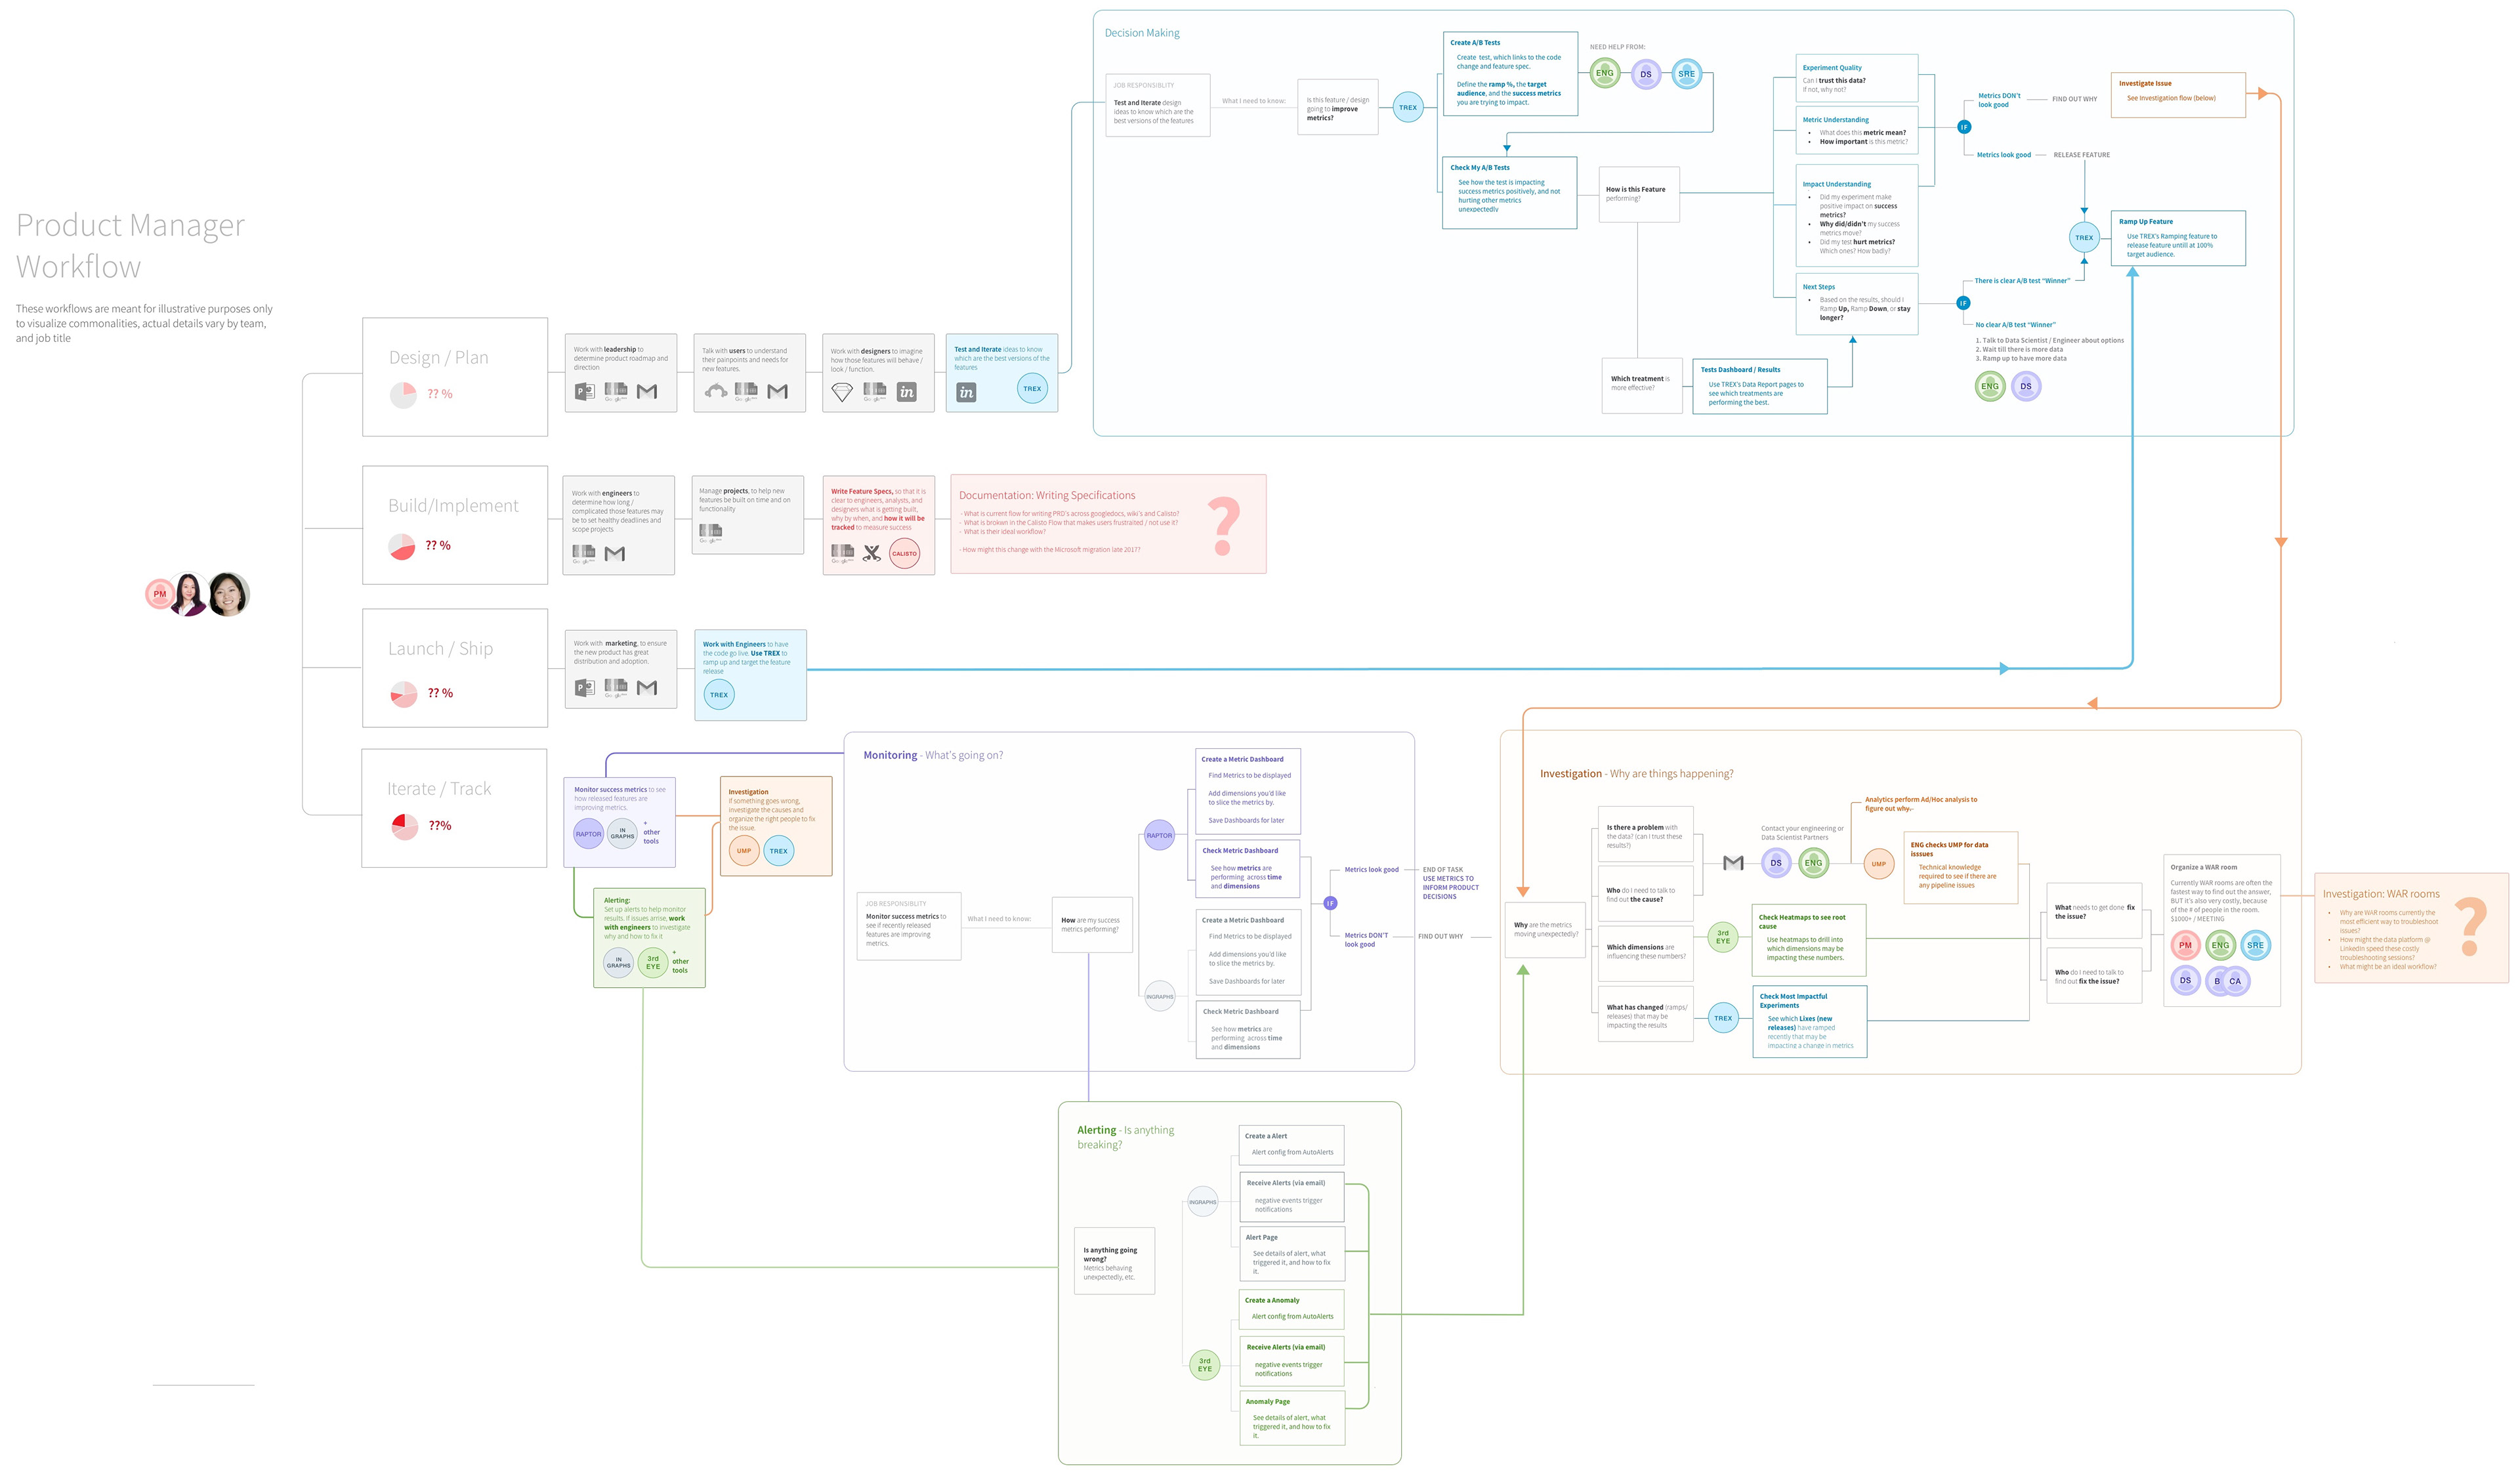
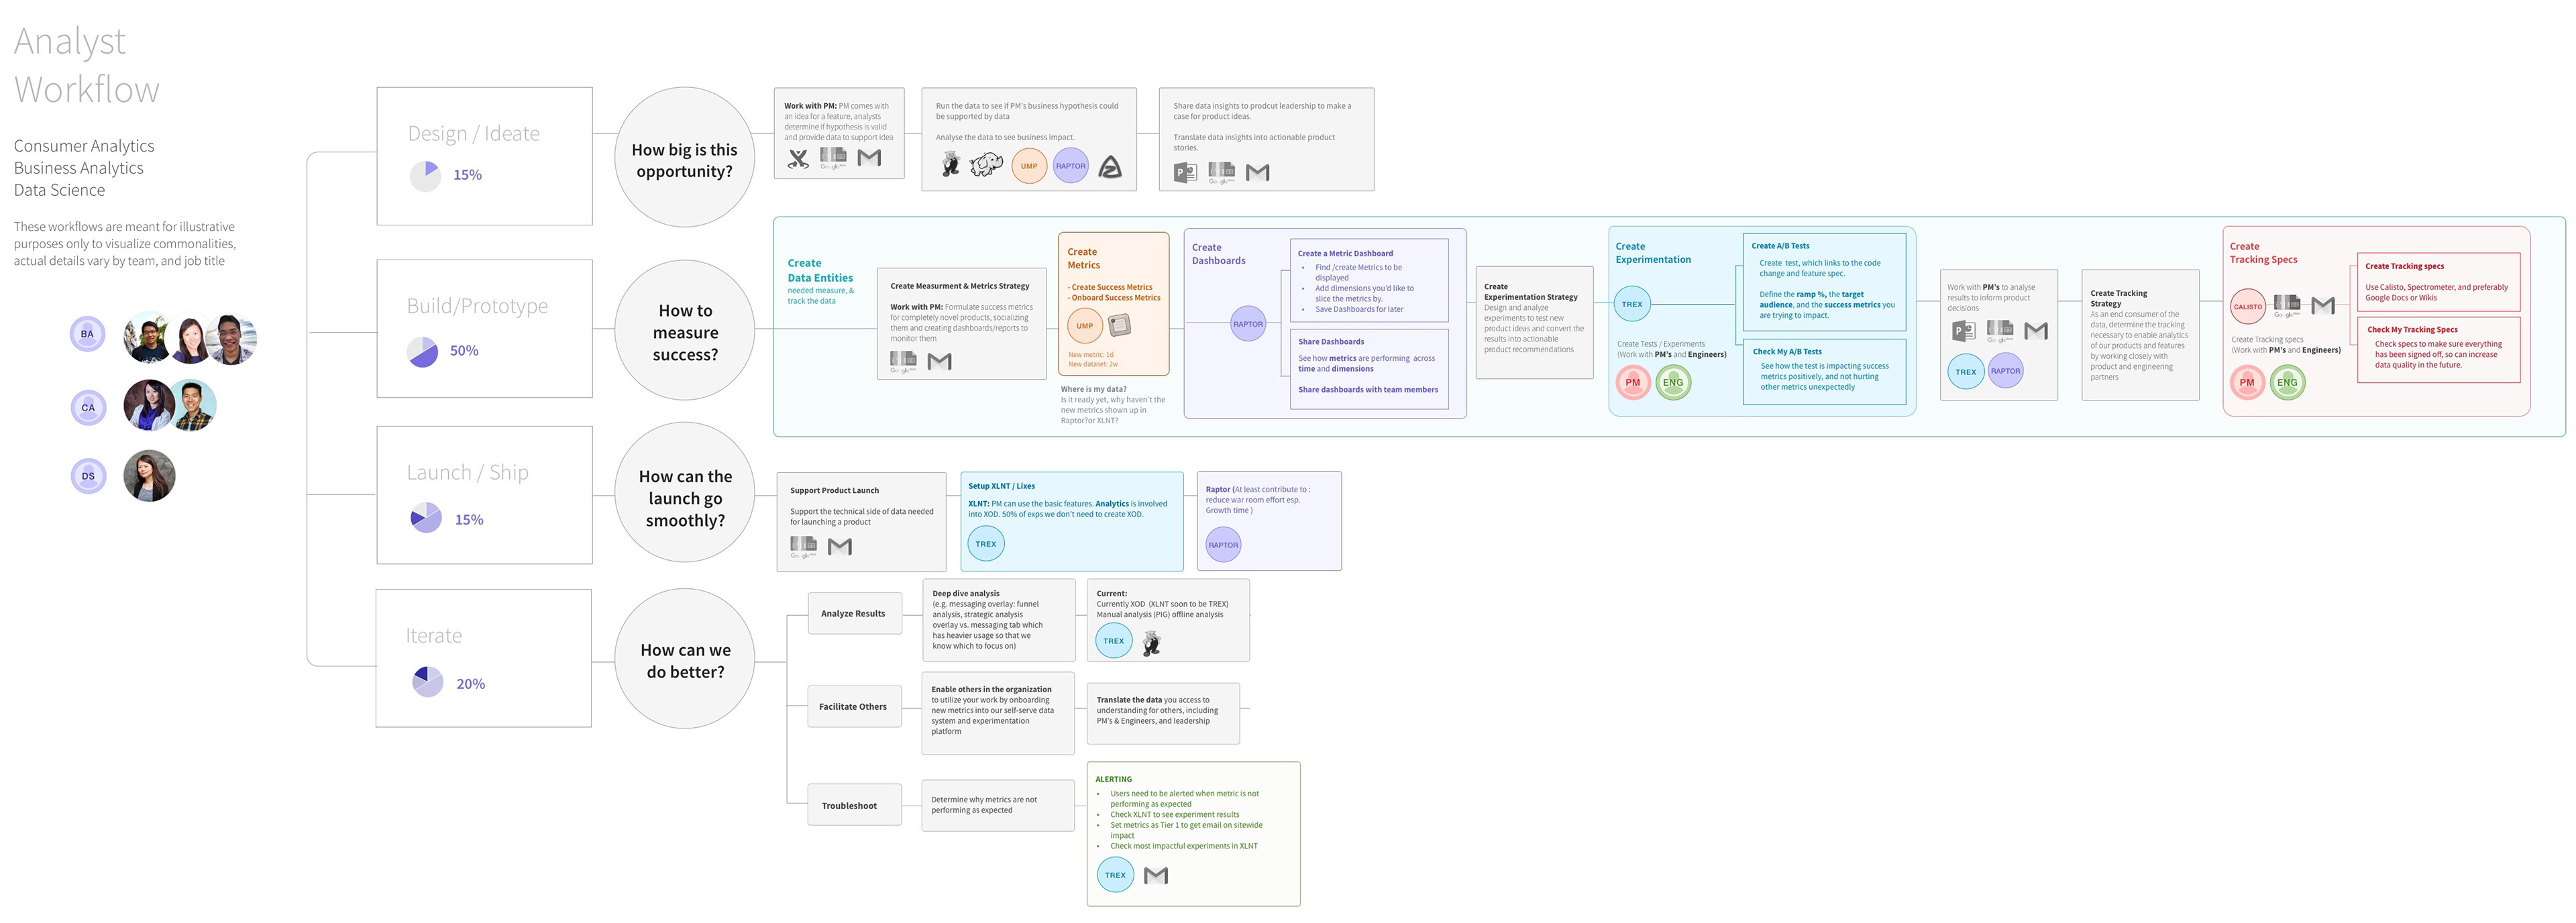
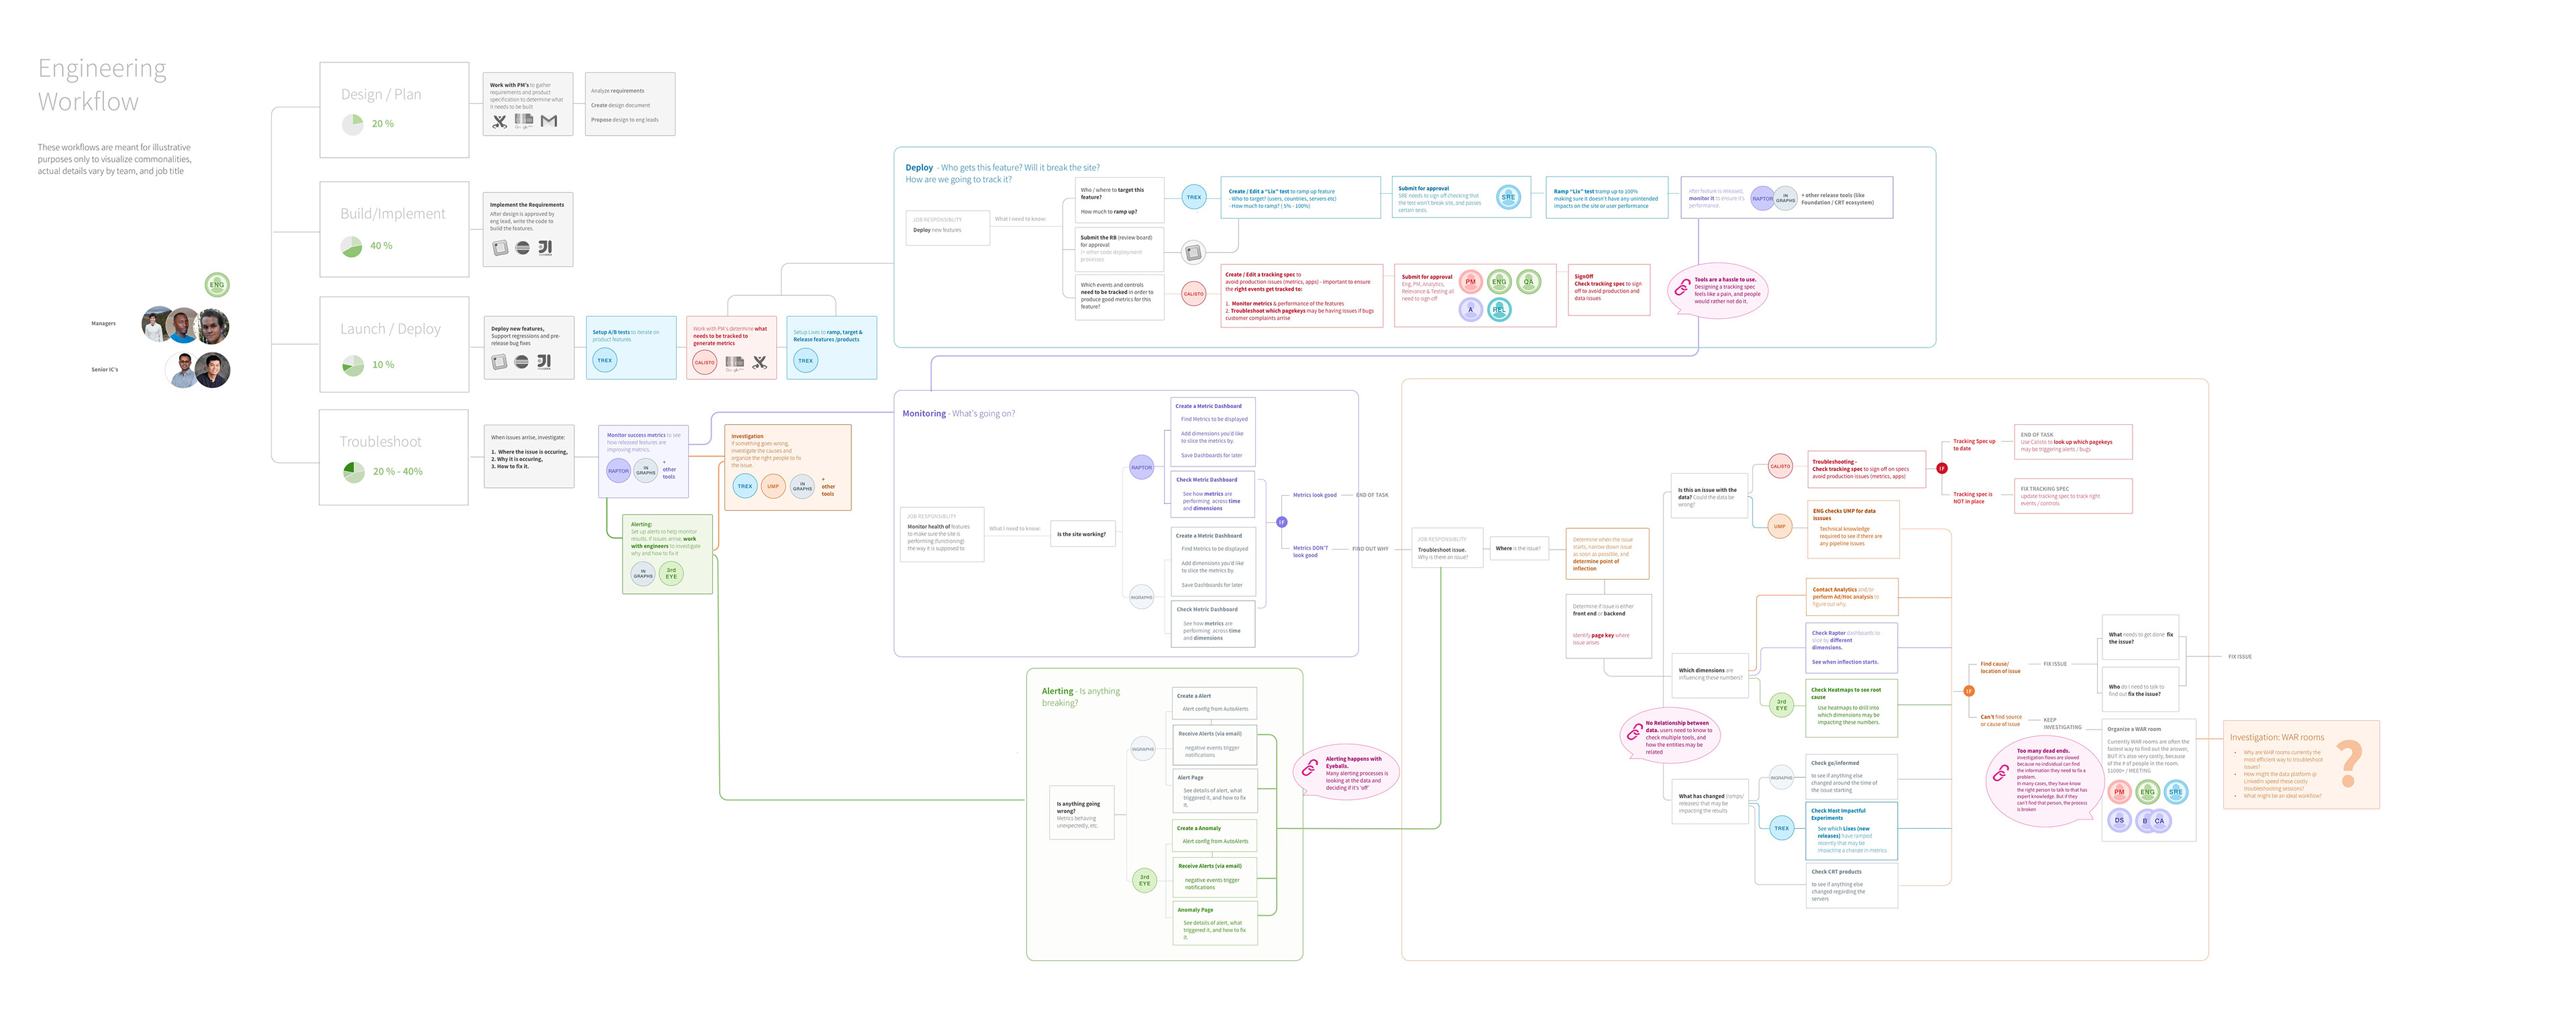
Tracked jobs & tasks across 10 + apps, and mapped each of their tasks up to the the ultimate goal of their job title, or Job to be Done.
- Analysts
- Business Operations
- Data Engineering: both data producers and data tools developers
- Product Management
- Data Scientists
Research Outcome:
The user research revealed that people must use a wide ranges of internal and external tools to do their jobs, from creating the data, to analyzing, to maintaining the data. Data Management Tools help build and maintain the data, while Data Decision Making Tools help visualize the data to help people make good decisions.
Problem: Broken Workflows, Disjointed Apps:
Users struggle to stitch together their tasks across a wide collection of disjointed tools all built using completely different UI, search mechanisms, sitemap structures and more.
Example: Metrics 4 different tools helped users see different aspects of metrics (pipeline, anomalies, A/B test, performance monitoring, and more):
- Different tools for different tasks
- Different search mechanisms, naming, and filters
- Different look and feel and page layouts
Need: Central way to find the objects across the system and connect the workflows across the apps.
Solution:
- Consistent UI look & feel
- Central Search
- Consistent Entity Pages, with central metadata page and sub-pages to support individual tasks previously distributed in other apps.
Design Solution: The Atlas Prototype
Search -> View -> Tasks
Centralizing Apps' architecture around Finding, Viewing and Creating Objects
While mapping all the data apps at LinkedIn, I realized that many of the apps performed different types of tasks on the same types of objects. This revealed a pattern that all the apps followed similar patterns, even though their UIs looked totally different:
Search for Objects
Edit / Create Objects
View Objects
Explore & Objects
Central Search
Instead of having to go to a handful to tools to do a few different things to the same object, I designed a central search portal. Now users can go to one place to find the object they want. The central portal displays information from across the old apps, and so users can easily see the content at a glance, then navigate into performing the tasks in the respective apps.
Standardized Search Results Pages
With multiple types of discovery options, including better search with advanced Filters, Featured Results (recommended for consumption), and Saved Searches.
Entity Landing Pages
Most data apps in the data ecosystem deal with doing actions on data entities, like metrics, datasets, dashboards and more. With this central portal, all object pages have similar layouts and templates. The entity overview page features content from all related apps, and can link to sub-pages or out to the workflow/task apps.
Connecting the different apps through a connected relationship graph means we can help connect users' workflows, without the overhead of building a MegaApp.
Outcome: DataHub
The Foundation of DataHub:
The Connected Data UX structure and the Atlas Prototype paved the way to building DataHub, now the leading open source metadata search catalogue in the industry.
Members of our original Atlas tiger team have gone on to start Metaphor Data, which creates a public solutions using the DataHub open source technology to serve a wider range of companies across the industry.
Success of DataHub
What's Next?
As the data management department has grown, and more data technology is built, and the UI has the opportunity to do a better job helping people create and maintain their data across apps.
Expanding DataHub from a Central Search Portal to flexible and scalable Data Management Platform.
With an expanded information architecture the new platform can better power user's jobs to be done, support infinite extensions to build in new technologies, and integrate with existing external data management tools and workflows.


