Data Quality Summary
This page gives a small glimpse of a few of the data quality design projects I worked on in 2022.
Please contact me for detailed case studies.
Projects Details
Timeframe: Fall 2021 - Summer 2022
Design Projects: 5
Teams Served: 3
Teams & Collaborators
Data Quality Team:
A Data Engineering who were inventing new ways to visualize the trustworthiness of data. The project created a precedent for how new features can be integrated with DataHub while developed by other teams.
DataHub - Lineage & Investigation Team:
Part of the central DataHub team helping users explore how data is created and its genealogy across the data pipeline.
Data Mesh Team:
A data engineering team building a new way to pull quality data together from different sources in one domain console so that users can see aggregated trustworthy grades across the data.
My Role as Product Designer
IC Staff Designer:
Solo Designer working directly with multiple data teams simultaneously and creating integrated consistent UX across projects
Entire design process from start to finish, including defining requirements, user journeys, wireframes, and low, mid, and high-fi mocks, plus supporting the Front End engineers every step of the way as they built and shipped the final product.
System UX Architect
Built these projects while also defining the overall platform architecture for all of LinkedIn's Data Management tools.
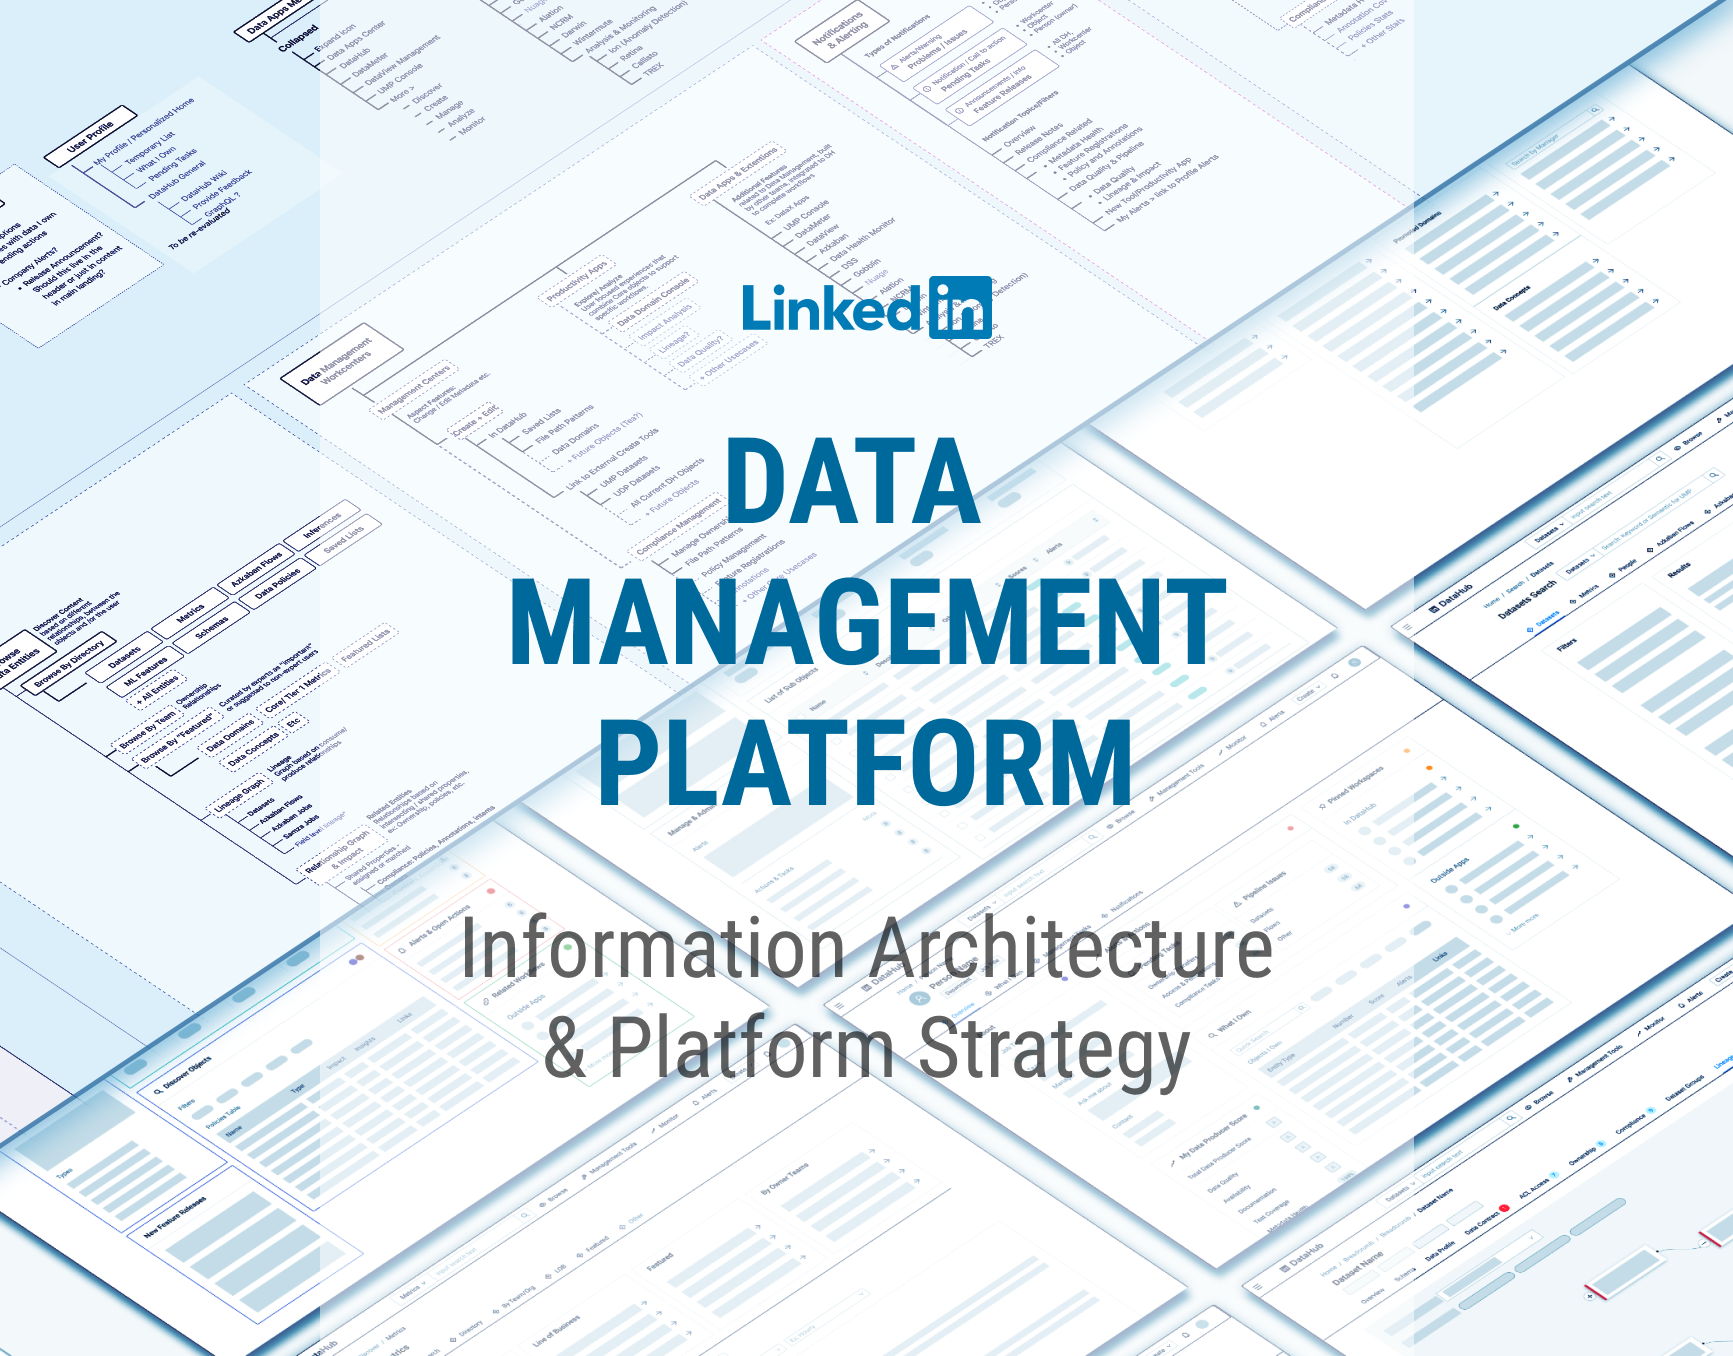
See DataHub Information Architecture for details.
UX Product Manager
Worked directly with engineers and provided product management when there were no PMs on the project.
What is Data Management?
Context: How is data produced?
Here is a simplified version of how data is created and produced:
1. Tracking - Behaviors (like clicks on a website page) must first be tracked and recorded as raw data.
2. Producing Data - Raw data is then transformed into more helpful formats, like datasets and metrics, through a series of calculations called "flows." Example: clicks + IP addresses can be combined into metrics: page views & countries. Or rather, how many people are using certain products in different countries.
3. Data Pipeline "Consumption" - More data is then created by combining the datasets in new ways. The data pipeline is a series of flows and datasets that produce and create each other.
Example: Imagine this as a series of equations, like X + Y = Z, where the formula is the flow, and X, Y, and Z are the datasets.
- One person (data producer 1) may create Dataset Z, by writing Flow 1: X + Y = Z
- Another person (data producer 2) creates another dataset, Dataset V, by writing Flow 2: Z - T = V.
4. Metric Analysis & Consumption - The end-users of the data are the people who use metrics to make decisions. Data Analysts, Data Scientists, Product Managers, and Executive leadership are some of the final consumers of the data.
What is Data Quality?
Data Tools to Manage Quality & Trust
Data Quality Tools builds systems to help data workers trust the data and know that it is being recorded, calculated, and stored correctly. These tools also help data workers identify, find root causes, and fix issues if they do come up.
- Quality Standards: I need a way to set quality standards for my data so everyone knows that it is trustworthy
- Consistency: I want a way to visualize how consistent my data is so that I know if there is missing data.
- Lineage: I want a way to see how my data is created upstream and what is reading it downstream.
- Investigation: If there is a problem in the data, I want to find out where the problem is upstream and how to fix it.
- Impact Analysis: If my data has problems, I need to contact the downstream consumers that there is a problem and that it is fixed.
User Stories & Pain Points
User Story 1: Data Analyst
Can I trust the data behind my metrics?
As a Data Analyst, I monitor my team's metrics in order to track my team's success. But when a metric changes unexpectedly, I need to be able to trust the performance of the metric.
- Is there a change in user behavior and metrics performance?
- Or is there a problem with how data is made?
User Story 2: Data Worker - Producer
Am I creating trustworthy data?
As a Data Producer, I am in charge of creating trustworthy and consistent datasets and metrics. When analysts and consumers look at the data, they can trust that it accurately represents the performance in their metrics and not worry if there is a problem in the data pipeline.User Story 3: Data Worker - Consumer
Can I build my data off this data?
As a Data Worker producing data, I want to build my data from reliable, consistent datasets. Design Process
1. Gather requirements
Understanding user needs & technology being built
2. Brainstorm:
Explore a wide range of design solutions through sketches, wireframes, and industry comps, User Journeys and confirm that the design meets the requirements of the technology
3. Iterate & Refine Designs:
Iterate based on actual data, user feedback, and feasibility possibilities of how it will be built.
4. Ship MVP and phased improvements
Support the development process by working closely with engineers to make sure the product is built the same way it was finalized in the design phase or intelligent user experience changes are made to overcome development challenges or use cases.
Data Quality Products - 2022
Data Contract
Should I read this data?
A Data Contract is a commitment from Data Producers (people who make the data) that a dataset should meet certain criteria in order to be used by others.
This improves Data Quality and helps Data Consumers (people who read the data) know that it is trustworthy
A Data Contract is a commitment from Data Producers (people who make the data) that a dataset should meet certain criteria in order to be used by others.
This improves Data Quality and helps Data Consumers (people who read the data) know that it is trustworthy
Data Profile
Is this data consistent?
A Data Profile is a snapshot of the shape of the data and how consistent its quality is over time. Just like a book knows its number of pages, the profile reads how big the dataset is, how many rows, columns, file size, etc.
This helps users decide if they should trust this data because inconsistent size and shape may indicate data is not being read accurately.
Design Problem: Data Visualization: How to represent both the latest value of a metric and the historical trend in an easy-to-read way?
Design Solution: leverage the existing list of fields in a dataset to show one column with a chart of the latest execution to be compared with a second column showing the long-term trend over time.
Worked with the same engineer who I worked with in 2018 to develop Data Visualization Best Practices and a Library to be used across all LinkedIn products.
Lineage & Investigation
What's causing the problem upstream?
Data is created like a large family tree, where any given dataset is made by consuming other data.
A data lineage is the map of the family tree. It can be used to understand the relationships of what is upstream (data used to create a dataset) and what is downstream (data consuming a dataset).
To investigate problems, gaps, or data quality issues, data workers want to look up the family tree to see where the problem is.
Investigate via Quality & Lineage Graph
Exploring the map to find the problem
As users look for the problem, they can click on any node on the graph and pull up a summary card of that dataset, including its data contract execution success history and who to contact about the problematic data.
Domains & Data Mesh
A curated collection of quality data
LinkedIn's Data Mesh team is spearheading the creation of data domains - a curated list of data products (datasets).
The collection has a quality score based on the grading of each of the data products in the list.


